
“Only 5% of Congestion Is Caused by Poor Signal Timing” — Is This 20-Year-Old Figure Still Valid?

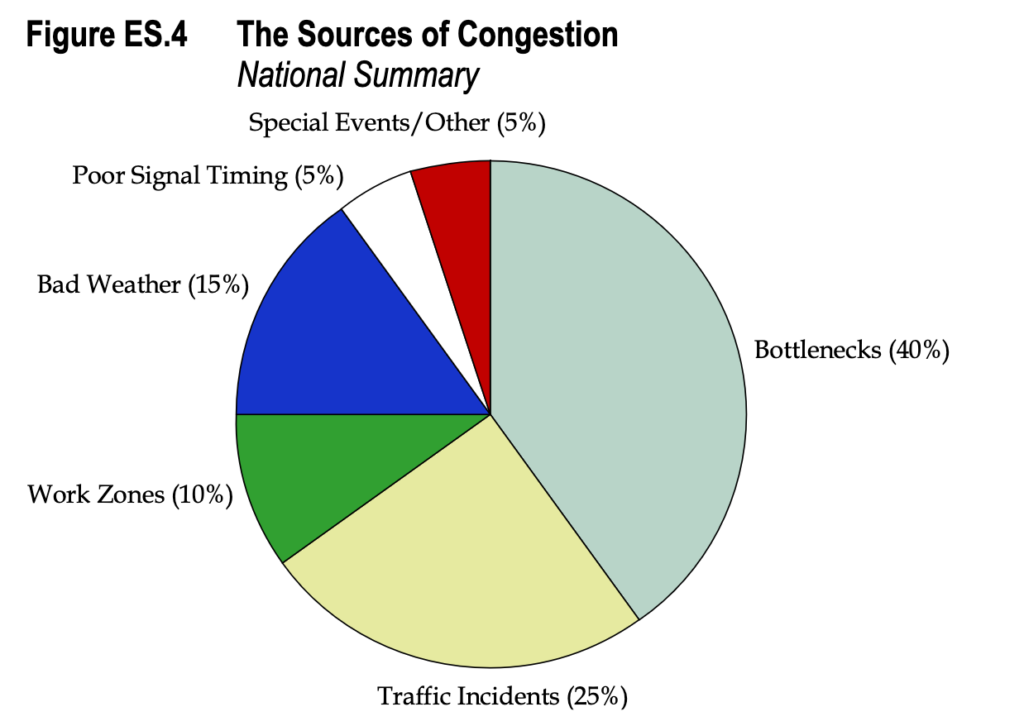
Reference: Traffic Congestion and Reliability: Linking Solutions to Problems, Federal Highway Administration (FHWA), July 19, 2004. Report No. FHWA-HOP-05-004
A widely circulated FHWA chart breaks down the causes of traffic congestion in the United States. One number in particular often attracts attention:
Only 5% of congestion is caused by poor signal timing.
But this chart is now more than 20 years old. So the obvious question is: is it still 5% today?
1. Where Did the 5% Figure Come From?
The figure comes from a 2004 report published by the Federal Highway Administration (FHWA) titled Traffic Congestion and Reliability: Linking Solutions to Problems.
The report estimated the sources of congestion as follows:
- 40% — Bottlenecks
- 25% — Traffic incidents
- 15% — Bad weather
- 10% — Work zones
- 5% — Poor signal timing
- 5% — Special events and other causes
There is, however, an important detail.
This was not a nationwide census of every congested road in the United States.
FHWA described the figures as a “composite estimate,” meaning that they were based on a combination of multiple existing studies. FHWA also explicitly referred to them as “rough approximations.”
The figures were later cited repeatedly in other FHWA publications. For example, the 2012 Urban Congestion Trends report was still using the same 40%–25%–15%–10%–5%–5% breakdown.
In 2016, FHWA revisited the issue in Traffic Bottlenecks: Identification and Solutions. The report noted that FHWA had been citing the “40% bottlenecks + 5% poor signal timing” figures for at least 15 years, and that the estimates were largely based on earlier studies, particularly work associated with the I-95 corridor.
So strictly speaking, the 5% figure is a historical estimate, not a number that has been recalculated every year.
2. What Do the Latest Data Say?
I looked at FHWA’s latest publicly available national congestion report.
The most recent report is 2024 Urban Congestion Trends, published by FHWA in 2025. It covers traffic conditions across 52 large metropolitan areas in the United States.
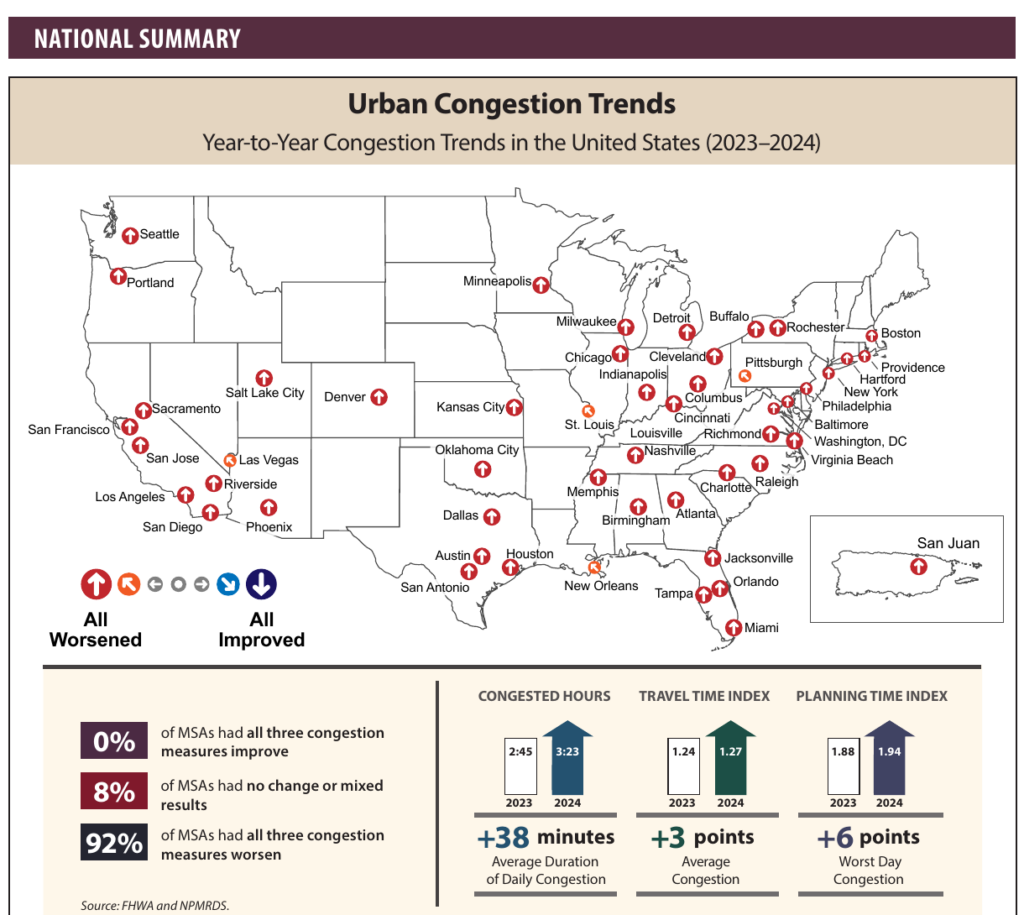
Reference: FHWA, 2024 Urban Congestion Trends, Report No. FHWA-HOP-25-195
The 2024 results show that:
- Average daily congested time increased by 38 minutes compared with 2023.
- That represents an increase of more than 20%.
- In 92% of the 52 metropolitan areas, all three major congestion indicators became worse.
What FHWA measures today, however, is somewhat different.
The current focus is mainly on indicators such as:
- Congested Hours
- Travel Time Index (TTI)
- Planning Time Index (PTI)
In other words, FHWA now puts more emphasis on questions such as:
- How many hours per day is a corridor congested?
- How much longer does a trip take compared with free-flow conditions?
- How reliable or unpredictable is travel time?
The latest report does not provide a new national breakdown of congestion causes.
So there is currently no updated FHWA figure that allows us to say:
“Poor signal timing still accounts for exactly 5% of congestion today.”
3. Why Do We Rarely See National Breakdowns Like 40%, 25% and 5% Anymore?
One reason is that congestion is difficult to attribute to a single cause.
Imagine a freeway that is already operating close to capacity. Rain begins, which reduces traffic speed. Then a minor crash blocks one lane, and the resulting queue rapidly grows. How should that congestion be classified? Weather? An incident? Or insufficient road capacity? In reality, these factors often interact.
Producing a national “cause of congestion” percentage also requires researchers to match travel-time data with detailed information about incidents, construction, weather, special events, signal operations and other conditions.
Transportation agencies may have very good speed and travel-time data, but they do not always have a complete cause label for every period of congestion.
The United States has also gradually shifted toward measuring outcomes rather than assigning every delay to a specific cause.
Since around 2012, FHWA has placed greater emphasis on measures such as travel-time reliability, freight reliability and peak-hour delay.
National datasets such as NPMRDS can continuously tell agencies:
Is this road congested?
How long is it congested?
Is it worse than last year?
But speed and travel-time data alone cannot always answer a different question:
Why exactly did this congestion happen?
So, for now, the answer is fairly simple:
There is no new FHWA national percentage that replaces the 2004 “5%” figure.
The number remains a useful historical reference, but it should not be presented as a current nationwide statistic.

